Coronavirus Tweet Analysis Project
The full code is available on Github
Main Question: How are People Responding to Coronavirus?
1. Webscraping of Coronavirus Tweets
- Polarity & Subjectivity: We scraped tweets with the word "coronavirus" in it in US.
- Economic & Diff Countries: We scraped tweets with the word "coronavirus" in it for top 10 corona countries.
-
Time period: February 11th, 2020 ~ April 21st, 2020
- Location: US (We divided US into US_east and US_west due to geolocation limitations and
combined the two)
- Process: To webscrape, we used the Python3 library GetOldTweets3and the
setTopTweets() to scrape only the most frequently retweeted tweets.
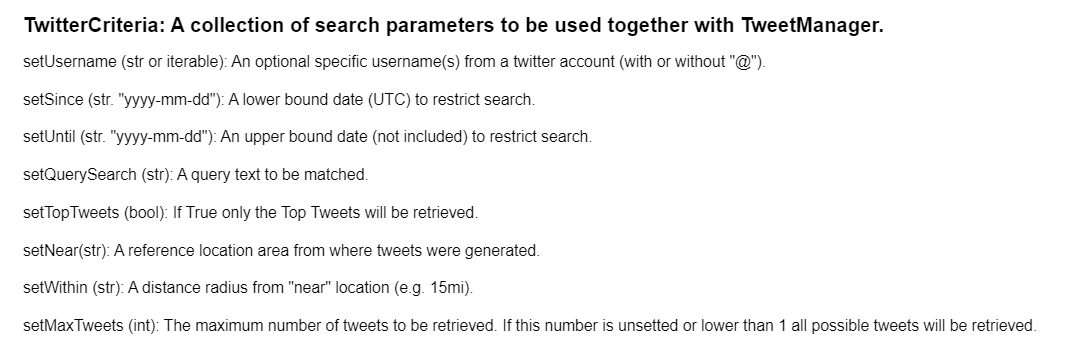
Webscraping Code
Below are the functions in GetOldTweets3
This is the code for webscraping the coronavirus tweets
>
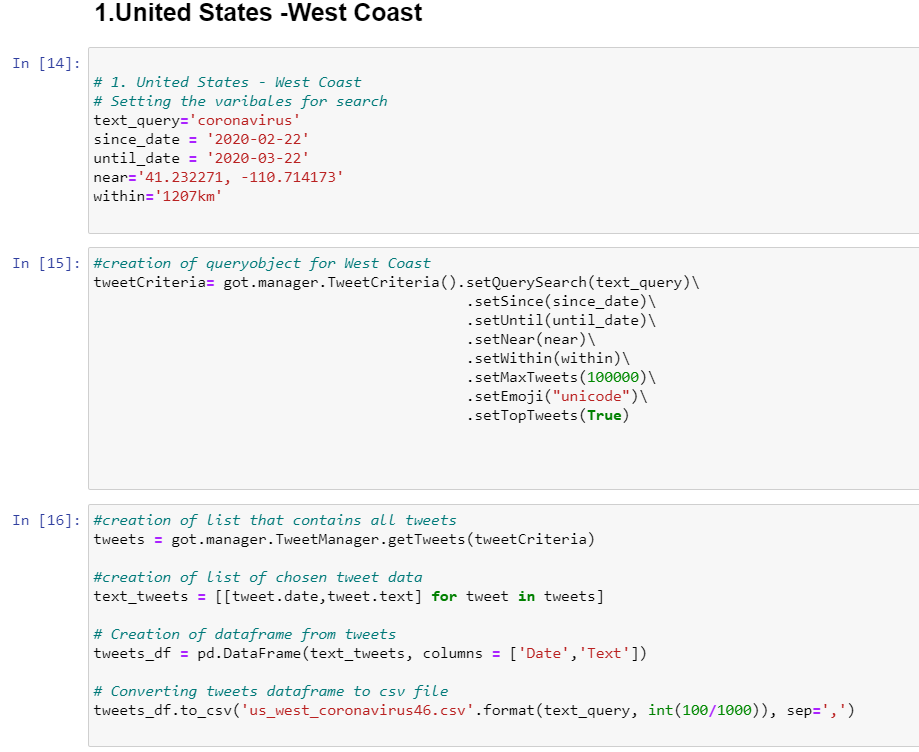
The same process was done for us_east and then we combined the two csv files
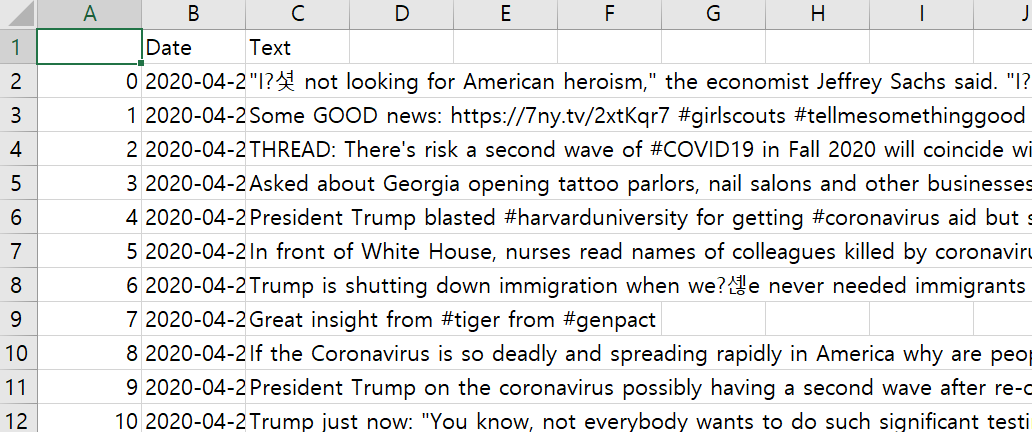
Final CSV
This is what our final csv looks like. It has two columns, the Date and the Tweets