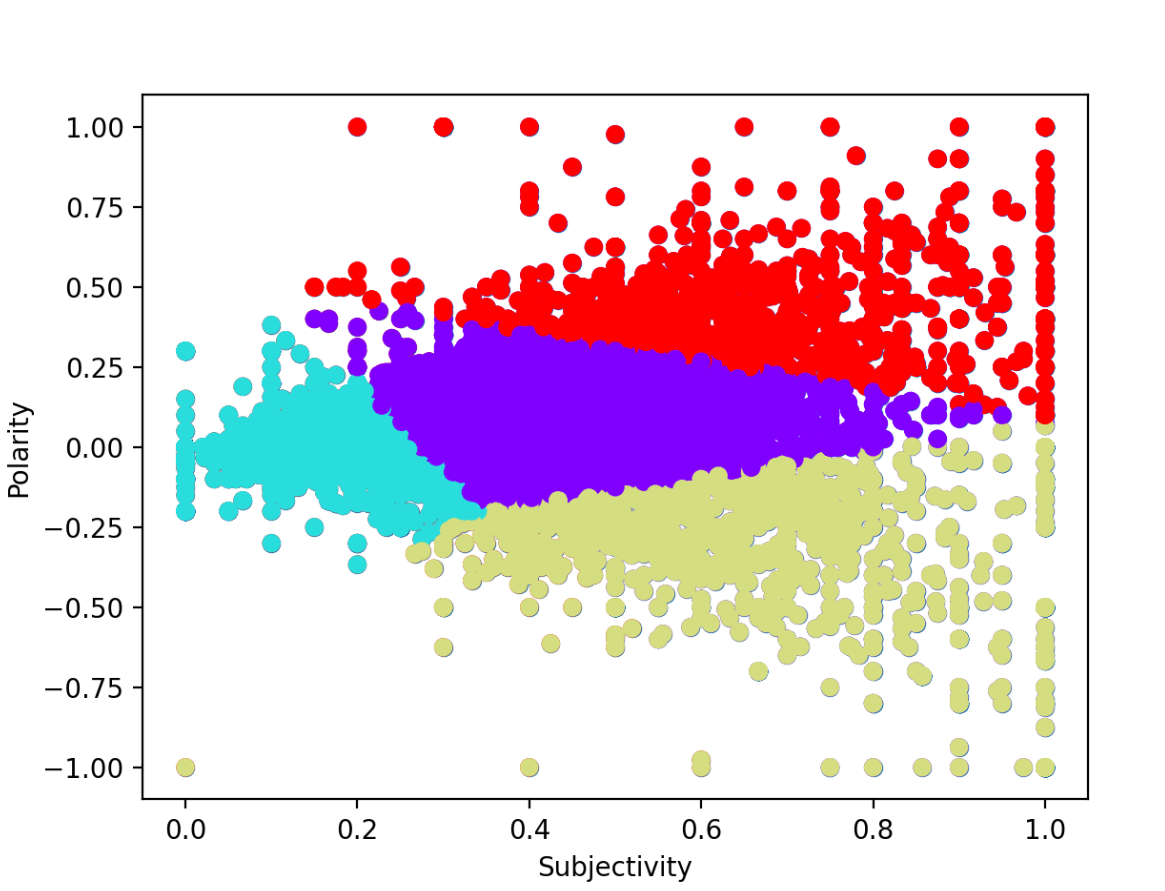
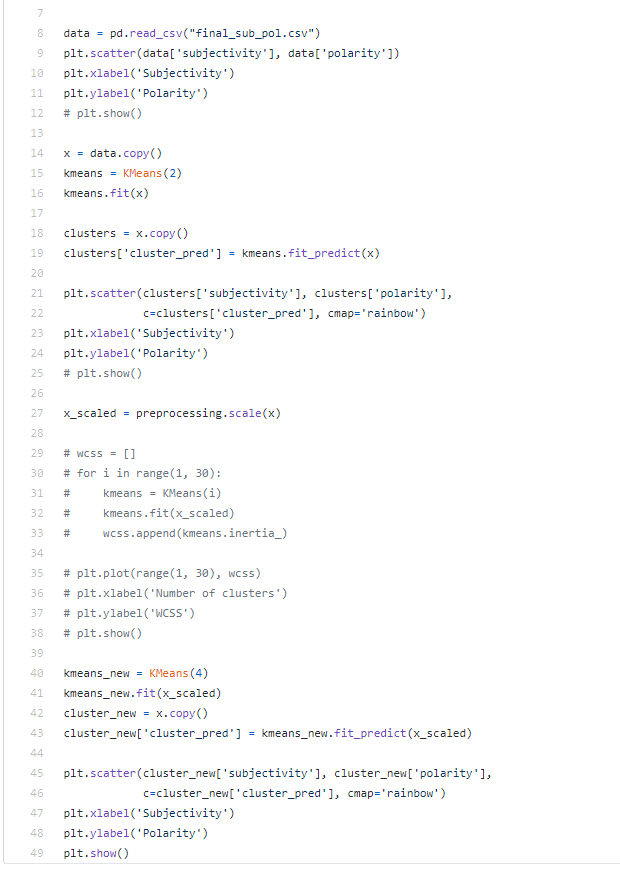
To cluster our tweets we decided to use k-means to create subjectivity polarity plot clusters. Below is the cluster visualization and code for our semtiment analysis plot.
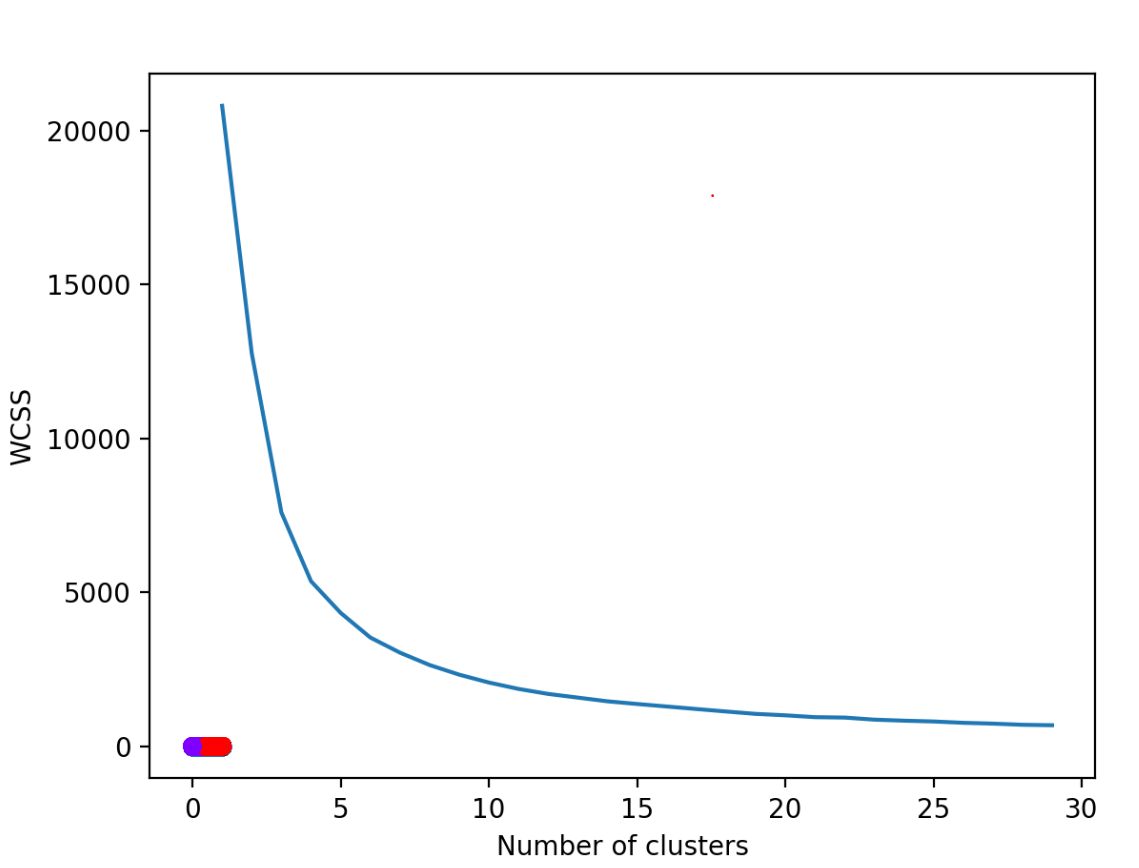
This is the result of our elbow plot. We can conclude that clusters of 3~4 are suggested.
The colors in this graph separate the four main clusters that resulted from our model